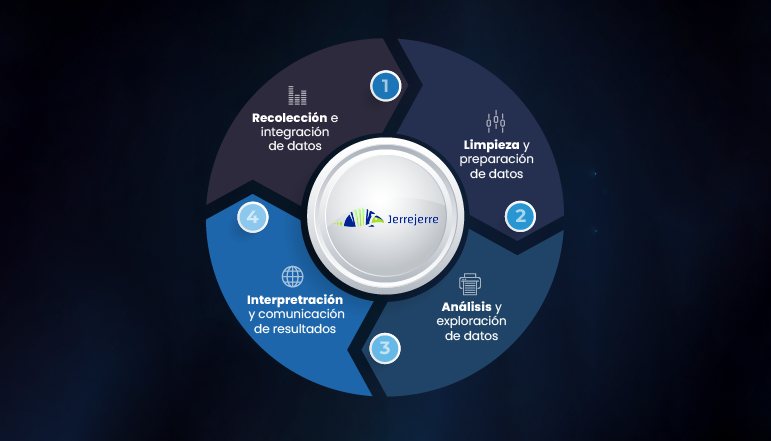
Today we share with you the four (4) fundamental pillars of data analysis so that any company—regardless of its size or sector—can make the most of its data, improve decision-making, and gain efficiency.
Pillar 1: Data Collection and Integration
The process begins by identifying all relevant information sources. For example: Excel files, databases, CRMs, ERPs, cloud platforms, third-party APIs, and more. Identifying and integrating business data is key to having a complete and reliable view, which avoids duplications and information loss.

Practical tip: Make an inventory of your information sources, ask each department where and how they store their data. Before using integration and automation tools, we recommend doing a manual review of some data to preliminarily identify patterns and relationships between them.
Pillar 2: Data Cleaning and Preparation
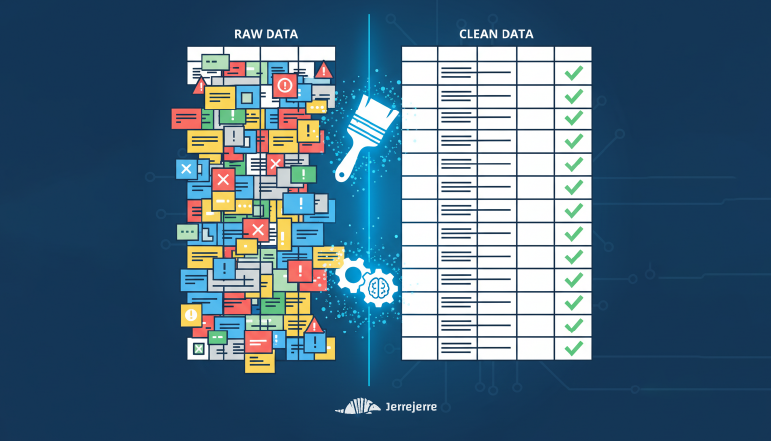
Before analyzing, you must clean and standardize the information: Carefully review the column and field names in your dataset, fix formatting errors, fill in missing data, and remove duplicates. I know it's a complicated task and data can vary a lot, but keep in mind: A dirty database only creates more doubts and errors. Data quality is the foundation for reliable analysis and sound decisions.

Practical tip: Create clear validation rules and use tools that automatically detect inconsistencies.
Automate data cleaning to save time and minimize manual errors.
Pillar 3: Data Analysis and Exploration
With clean data, we can begin to discover trends, patterns, and opportunities. Here are 3 key points:
- Define and monitor KPIs (key performance indicators) that are truly aligned with business objectives.
- Don’t rush to use interactive dashboards (even if that is the final goal). A prototype works very well here to deeply understand the data.
- Rely on data analysis tools and even artificial intelligence to speed up exploration, but as you know, it's essential to have “clean” data first. If you feed dirty data into Artificial Intelligence, you will most likely get an incorrect answer.

Practical tip: Involve different departments of the company in exploration: often, the best insights come from those involved in daily operations. Create prototypes for each of these areas; sometimes, the same indicator may be requested by different departments in several ways.
Pillar 4: Interpretation and Communication of Results
It's not enough to analyze; it is essential to turn findings into concrete decisions. Present the information clearly and interactively. Use intuitive dashboards, executive reports, and data storytelling. Communicate the results to the decision makers, not just to the technical area.

Practical tip: Remember that data always comes with a story. It's important to explain the methodology, include a glossary, and above all, each of the charts included in the dashboards should be accompanied by a brief explanation.
Conclusion
Always keep these 4 pillars of data analysis in mind. They are fundamental to turning your information into strategic assets.
Do you want to see how to apply these pillars in an agile, secure way, and leveraging artificial intelligence? At Jerrejerre we guide you step by step, with clear processes and proprietary tools that ensure quality and privacy at every stage.


